In this article, we'll show you how to analyze your data with Breadcrumbs Explore
Use Breadcrumbs Explore to view, filter, segment, and sort contacts and accounts based on any attributes across any connected data source and unlock powerful insights to compare scoring outputs side-by-side for any scoring model.
GET STARTED
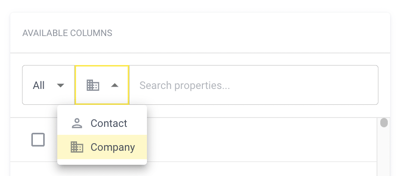
When using Breadcrumbs Explore, you can select:
A) Contact Properties (referring to an individual contact)
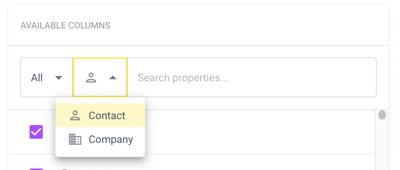
B) Company Properties (referring to an account)
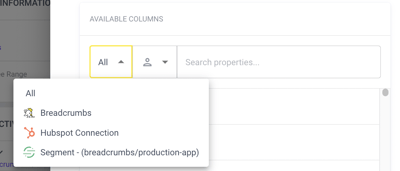
You can further refine your analysis by selecting:
a. Breadcrumbs Internal Properties. These properties include some of the most popular properties, scores, and grades from all your active and testing scoring models.
b. Data Source Properties. These properties include all the properties you have configured in your primary and secondary data sources.
You can start exploring, analyzing, and comparing your contacts, accounts, and models by following the below steps:
1) Log in to your Breadcrumbs account.
2) Select “Explore” in the left-side toolbar.
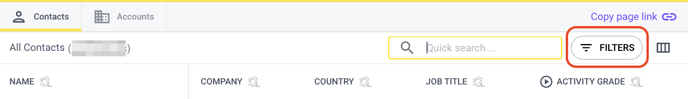
3) In the Explore list page, you first want to click “Contacts” to display the list of your contacts or “Accounts” to display the companies in your list.
CUSTOMIZE, FILTER, AND SEGMENT YOUR LIST
Filters and segments allow you to dive deep into your data, making it easily accessible and available to others on your team, and customize your views based on your goals and objectives.
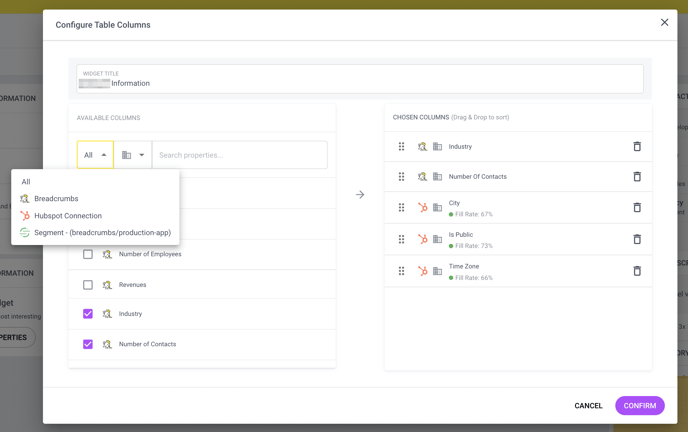
4) When browsing contacts, you can configure which data columns are displayed using the ‘Configure Table Columns’ to select the desired data from any connected source and reorder the columns to format the data table based on your preference.
5) Filter your list by clicking the Filter icon located on the top right-hand side of the Explore main page and selecting any combination of contact and company properties.
6) Create Segments based on any filter you build by clicking on the Save Segment button. The Segment will then be available in the left navigation bar for further use.
Note: Segments are saved and tied to workspaces; each workspace can use saved segments for different models and objectives.
7) Quick search for a specific contact or company by typing in a text in the quick search bar located in the top navigation.
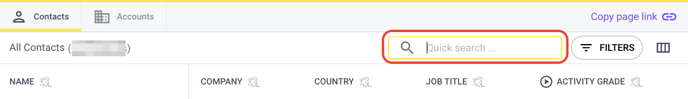
Note: you can’t save quick searches.
ANALYZE A CONTACT
You can explore and analyze your data at the contact level.
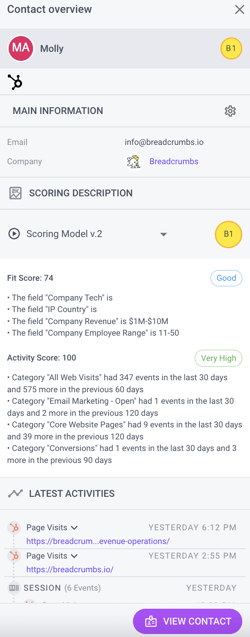
8) From the Explore Contact list, click on any contact for a high-level view of a contact’s scoring insights based on any test or active model.
- Active is the default, but you can select test models from the dropdown.
- The score description provides context around what scoring criteria went into their score.
- An overview of the contact’s latest activities (page visits, email opens/clicks, form fills, and more.)
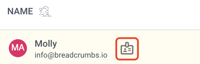
Tip: For a complete view of a contact’s information and activities, click on the "View Contact" button or on the badge next to a contact name to open the contact page–the badge is visible when hovering over the contact’s row.
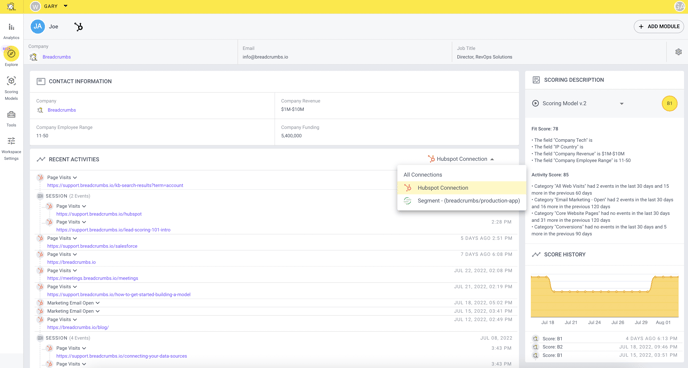
The contact page includes the scoring insights from the overview, plus the ability to customize modules and add data table widgets based on any attributes you want to group, such as core company information, contact information, product engagement, and more.
ANALYZE A COMPANY ACCOUNT
Similarly, you can explore and analyze your data at the company level.
9) From the Explore Accounts list, Explore Contact list, or the Contact overview page, click on the corresponding company name for a high-level view of a company’s scoring insights based on any test or active model.
- Active is the default, but you can select test models from the dropdown.
- The score description provides context around what scoring criteria went into their score.
- The 5 Top Contacts widget shows the five best users from that company.
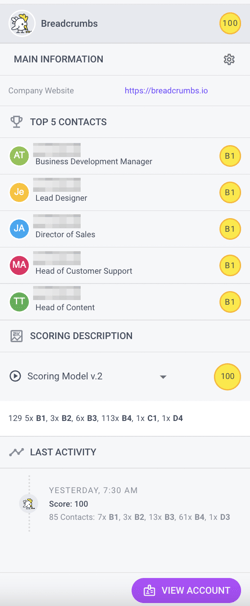
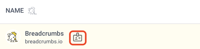
Tip: For a complete view of a company’s information and activities, click on the "View account" button or on the badge next to a company name from the Explore Accounts list to open the account page–the badge is visible when hovering over the account’s row.
The account overview page includes the scoring insights from the overview, plus the ability to customize modules and add data table widgets based on any attributes you want to group, such as core company information, product engagement, and more.
Note: On this page, you can:
- View 5 Top Contacts widget, showing the five best users from that company.
- Pull information from company properties only.
Please look at our Breadcrumbs Explore Release Notes for more information on best practices and use cases.